xrects
draw or fill a set of rectangles
Syntax
xrects(rects,[fill])
Arguments
- rects
matrix of size (4,n).
- fill
vector of size n.
Description
xrects draws or fills a set of rectangles.
Each column of rects describes
a rectangle (upper-left point, width, height) in user coordinates:
rects=[x1 x2... ; y1 y2... ; w1 w2... ; h1 h2...].
fill(i) gives the pattern to use for filling or drawing rectangle i:
if fill(i)<0, rectangle i is drawn using the line style (or
color) -fill(i)
if fill(i)>0, rectangle i is filled using the pattern (or
color) fill(i)
if fill(i)=0, rectangle i is drawn using the current
line style (or color).
 | Please note that height is positive downwards. |
| Created rectangles inherits the clip property from the current axes. |
Examples
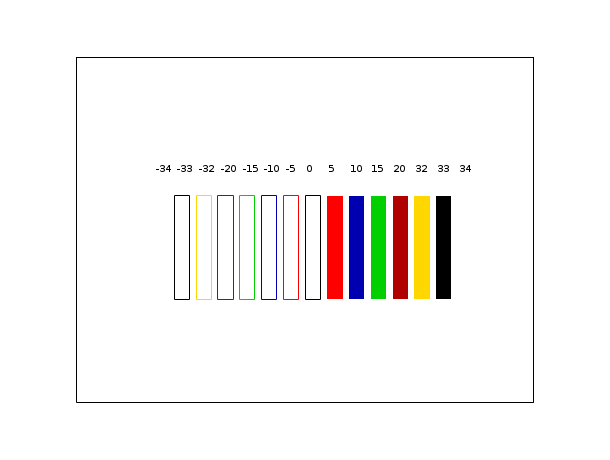
plot2d([-100,500],[-50,50],[-1,-1],"022")
cols=[-34,-33,-32,-20:5:20,32,33,34];
x=400*(0:14)/14; step=20;
rects=[x;10*ones(x);step*ones(x);30*ones(x)];
xrects(rects,cols)
xnumb(x,15*ones(x),cols)
| Report an issue | ||
| << xrect | geometric_shapes | xsegs >> |