xstringl
compute a box which surrounds strings
Syntax
rect=xstringl(x,y,str,[fontId,fontSize])
Arguments
- rect
vector of 4 real scalars defining the box.
- x,y
real scalars, coordinates of the lower-left point of the strings.
- str
matrix of strings.
Starting from Scilab 5.2, it is possible to write LaTeX or MathML expression.
- fontId
an integer specifying the font type. For more information, see graphics_fonts
- fontSize
an integer specifying the font size. For more information, see graphics_fonts
Description
xstringl returns in rect=[x,y,w,h]
(upper-left point, width, height) the size of a rectangle in the current
graphic scale which would surround the strings str drawn at
location x,y (lower-left point).
The result can be approximative when using the Postscript driver.
Examples
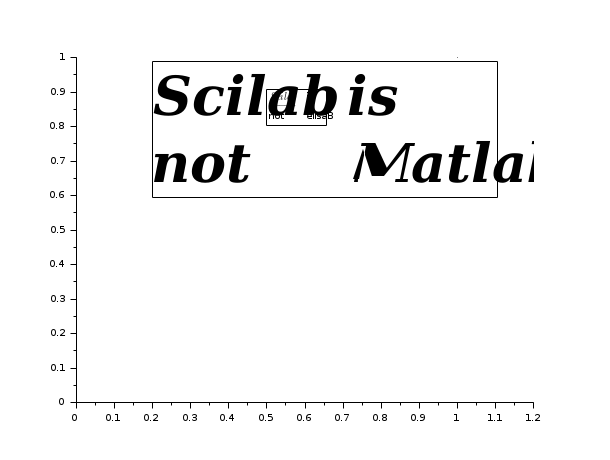
plot2d([0, 1], [0, 1], 0);
str = ["$\underleftrightarrow{Scilab}$" "is"; "not" "elisaB"]; // Only valid from Scilab 5.2
r = xstringl(0.5, 0.7, str);
xrects([r(1) r(2)+r(4) r(3) r(4)]');
xstring(r(1), r(2), str);

str = ["Scilab" "is"; "not" "Matlab"];
r2 = xstringl(0.2, 0.2, str, 5, 7);
xrects([r2(1) r2(2)+r2(4) r2(3) r2(4)]');
xstring(r2(1), r2(2), str)
txt = gce();
txt.font_size = 7;
txt.font_style = 5;
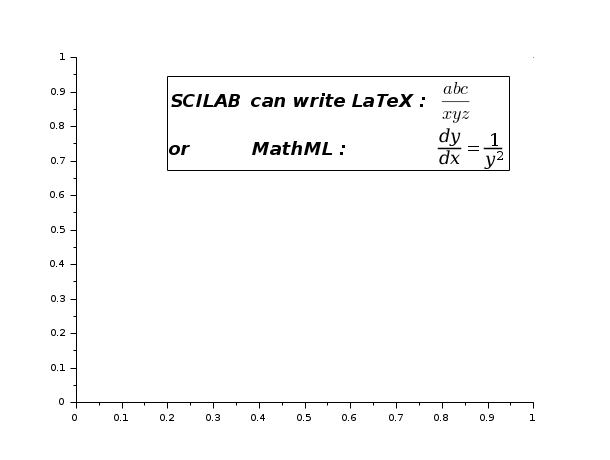
plot2d([0, 1], [0, 1], 0);
// Only valid from Scilab 5.2
mathml = "<mrow>" +..
            "<mfrac>" +..
                "<mrow>" +..
                    "<mi> d </mi>" +..
                    "<mi> y </mi>" +..
                "</mrow>" +..
                "<mrow>" +..
                    "<mi>d</mi>" +..
                    "<mi>x</mi>" +..
                "</mrow>" +..
            "</mfrac>" +..
                "<mo> = </mo>" +..
            "<mfrac>" +..
                "<mn> 1 </mn>" +..
                "<msup>" +..
                    "<mi> y </mi>" +..
                    "<mn> 2 </mn>" +..
                "</msup>" +..
            "</mfrac>" +..
         "</mrow>";
str=["SCILAB", "can write LaTeX :", "$\frac{abc}{xyz}$"; "or", "MathML :", mathml];
r2 = xstringl(0.2, 0.4, str, 10, 4);
xrects([r2(1) r2(2)+r2(4) r2(3) r2(4)]');
xstring(r2(1), r2(2), str);
txt = gce();
txt.font_size = 4;
txt.font_style = 10;
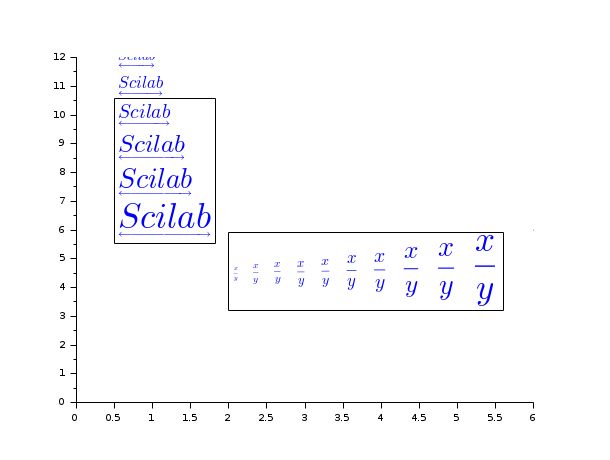
plot2d([0, 6],[0, 6], 0);
str=["$\underleftrightarrow{\tiny{Scilab}}$"; "$\underleftrightarrow{\scriptsize{Scilab}}$";
     "$\underleftrightarrow{\footnotesize{Scilab}}$"; "$\underleftrightarrow{\small{Scilab}}$";
     "$\underleftrightarrow{\normalsize{Scilab}}$"; "$\underleftrightarrow{\large{Scilab}}$";
     "$\underleftrightarrow{\Large{Scilab}}$"; "$\underleftrightarrow{\LARGE{Scilab}}$";
     "$\underleftrightarrow{\huge{Scilab}}$"; "$\underleftrightarrow{\Huge{Scilab}}$"];
r = xstringl(0.5, 0.5, str, 5, 3);
xrects([r(1); r(2)+r(4); r(3); r(4)]);
xstring(r(1), r(2), str);
txt = gce();
txt.font_size = 3;
txt.font_style = 5;
txt.font_color = 2;

str = ["${\tiny{\frac{x}{y}}$", "${\scriptsize{\frac{x}{y}}$", ..
       "${\footnotesize{\frac{x}{y}}$", "${\small{\frac{x}{y}}$", ..
       "${\normalsize{\frac{x}{y}}$", "${\large{\frac{x}{y}}$", ..
       "${\Large{\frac{x}{y}}$", "${\LARGE{\frac{x}{y}}$", ..
       "${\huge{\frac{x}{y}}$", "$\Huge{\frac{x}{y}}$"];
r = xstringl(2, 0.5, str, 0, 3);
xrects([r(1); r(2)+r(4); r(3); r(4)]);
xstring(r(1), r(2), str);
txt = gce();
txt.font_size = 3;
txt.font_style = 0;
txt.font_color = 2;
See also
| Report an issue | ||
| << xstringb | text | transform >> |