detrend
remove constant, linear or piecewise linear trend from a vector
Syntax
y = detrend(x)
y = detrend(x,flag)
y = detrend(x,flag,bp)
Arguments
- x
vector or matrix of real or complex numbers (the signal to treat)
- flag
a string equal to "linear" (or "l") for linear or piecewise linear treatment or "constant" (or "c") for constant treatment.
- bp
the breakpoints to provide if you want a piecewise linear treatment.
- y
output, the signal x with the trend removed from it.
Description
This function removes the constant or linear or
piecewise linear trend from a vector x. In general
this can be useful before a fourier analysis. If x is
matrix this function removes the trend of each column of x.
When flag = "constant" or "c" detrend removes the constant trend
(simply the mean of the signal) and when flag = "linear" or "l" the function
removes the linear trend. By adding a third argument bp it is possible to
remove a continuous piecewise linear trend. Note that the "instants" of the signal
x goes from 0 to m-1 (m = length(x) if x is a vector and m = size(x,1) in case
x is a matrix). So the breakpoints bp(i) must be reals in [0 m-1]
(breakpoints outside are simply removed from bp vector).
The trend is got by a least square fit of x on the appropriate function space.
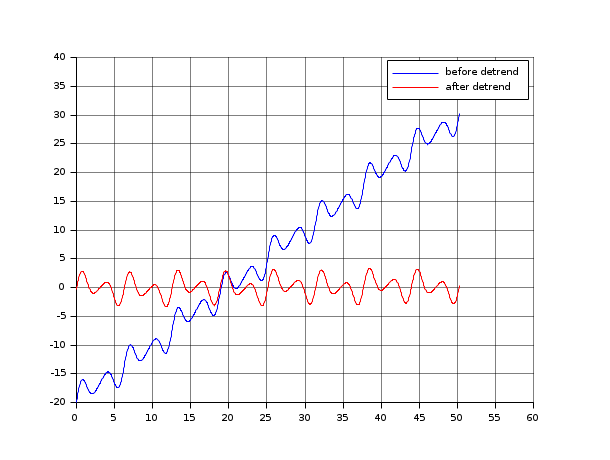
Examples
t = linspace(0,16*%pi,1000)';
x = -20 + t + 0.3*sin(0.5*t) + sin(t) + 2*sin(2*t) + 0.5*sin(3*t);
y = detrend(x);
clf()
plot2d(t,[x y],style=[2 5])
legend(["before detrend","after detrend"]);
xgrid()
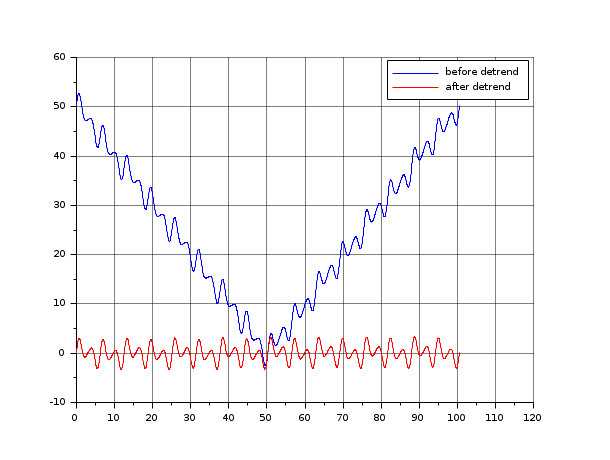
t = linspace(0,32*%pi,2000)';
x = abs(t-16*%pi) + 0.3*sin(0.5*t) + sin(t) + 2*sin(2*t) + 0.5*sin(3*t);
y = detrend(x,"linear",1000);
clf()
plot2d(t,[x y],style=[2 5])
legend(["before detrend","after detrend"]);
xgrid()
| Report an issue | ||
| << bilt | Traitement du Signal | intdec >> |