bode
Bode plot
Syntax
bode(sl)
bode(sl, fmin, fmax)
bode(sl, fmin, fmax, step)
bode(sl, frq)
bode(frq, db, phi)
bode(frq, repf)
bode(.., Captions)
bode(.., "rad")
Arguments
- sl
A siso or simo linear dynamical system, in state space, transfer function or zpk representations, in continuous or discrete time.
- fmin,fmax
real (frequency bounds (in Hz))
- step
real (logarithmic step.)
- frq
row vector or matrix (frequencies (in Hz) ) (one row for each SISO subsystem).
- db
row vector or matrix ( magnitudes (in Db)). (one row for each SISO subsystem).
- phi
row vector or matrix ( phases (in degree)) (one row for each SISO subsystem).
- repf
row vector or matrix of complex numbers (complex frequency response).
- Captions
vector of character strings (captions).
- "rad"
as last optional argument: displays the Bode plot versus Angular frequencies in rad/s, instead of versus frequencies in Hz.
Description
Bode plot, i.e magnitude and phase of the frequency
response of the linear dynamical system sl.
sl can be a continuous-time or
discrete-time SIMO system given by its state space,
rational transfer function (see syslin) or zpk representation. In case of
multi-output the outputs are plotted with different
colors.
The frequencies are given by the bounds fmin,fmax
(in Hz) or by a row-vector (or a matrix for multi-output)
frq.
step is the ( logarithmic ) discretization step.
(see calfrq for the choice of default value).
db,phi are the matrices of modulus (in Db) and
phases (in degrees). (One row for each response).
repf matrix of complex numbers. One row for each
response.
Default values for fmin and
fmax are 1.d-3,
1.d+3 if sl is continuous-time or
1.d-3, 0.5/sl.dt (nyquist frequency)
if sl is discrete-time. Automatic discretization of
frequencies is made by calfrq.
The datatips tool may be used to display data along the phase and modulus curves.
Examples
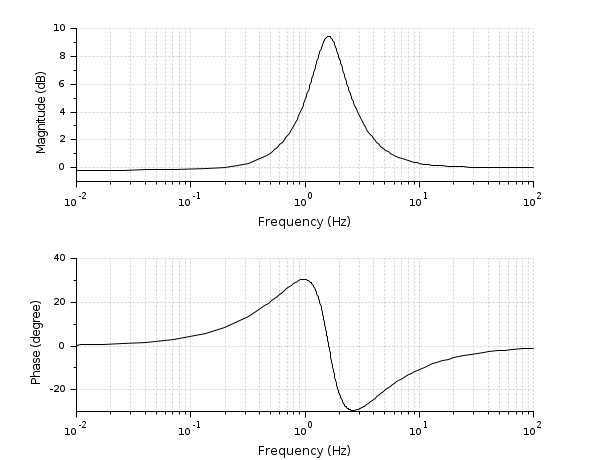
s = poly(0, 's');
h = syslin('c', (s^2+2*0.9*10*s+100)/(s^2+2*0.3*10.1*s+102.01));

clf(); bode(h, 0.01, 100);
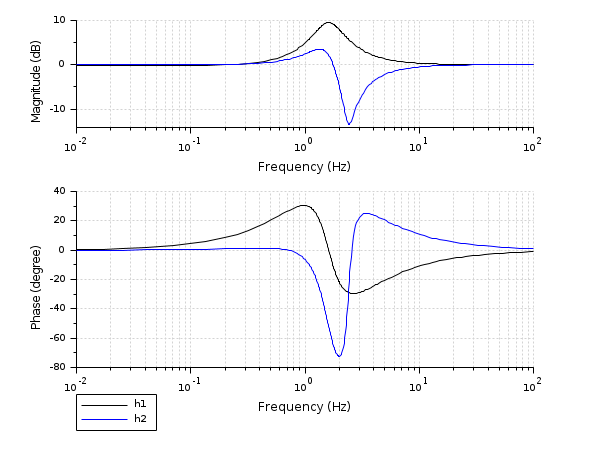
s = poly(0, 's');
h1 = syslin('c', (s^2+2*0.9*10*s+100)/(s^2+2*0.3*10.1*s+102.01));
num = 22801+4406.18*s+382.37*s^2+21.02*s^3+s^4;
den = 22952.25+4117.77*s+490.63*s^2+33.06*s^3+s^4;
h2 = syslin('c', num/den);

clf(); bode([h1; h2], 0.01, 100, ['h1'; 'h2']);
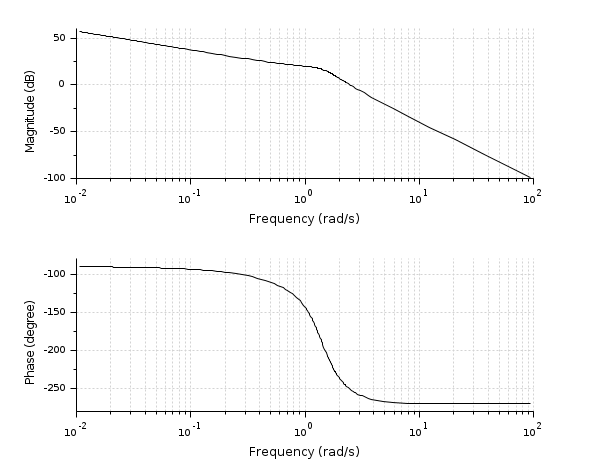
s = %s;
G = (10*(s+3))/(s*(s+2)*(s^2+s+2)); // A rational matrix
sys = syslin('c', G); // A continuous-time linear system in transfer matrix representation.
f_min = .0001; f_max = 15; // Frequencies in Hz

clf(); bode(sys, f_min, f_max, "rad"); // Converts Hz to rad/s
See also
- bode_asymp — Bode plot asymptote
- black — diagrama de Black (carta de Nichols)
- nyquist — diagrama de Nyquist
- gainplot — esboço de magnitude
- repfreq — frequency response
- g_margin — gain margin and associated crossover frequency
- p_margin — phase margin and associated crossover frequency
- calfrq — frequency response discretization
- phasemag — phase and magnitude computation
- datatips — Tool for placing and editing tips along the plotted curves
History
| Version | Description |
| 5.5.0 |
|
| 6.0 | handling zpk representation |
| Report an issue | ||
| << black | Frequency Domain | bode_asymp >> |