mese
maximum entropy spectral estimation
Syntax
[sm,fr]=mese(x [,npts]);
Arguments
- x
Input sampled data sequence
- npts
Optional parameter giving number of points of
frandsm(default is 256)- sm
Samples of spectral estimate on the frequency grid
fr- fr
npts equally spaced frequency samples in
[0,.5)
Description
Calculate the maximum entropy spectral estimate of x
Sample
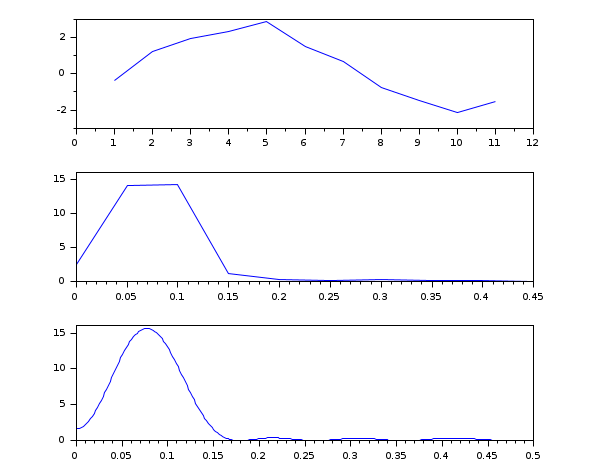
Examples
rand("seed",12345),
y = (0:10);
x1 = sin(2*%pi*y/20);
x2 = sin(3.5*%pi*y/20);
w = .4*(rand(y)-.5*ones(y));
x = x1+2*x2+w;
[sm,fr1] = mese(x,10)
// Define macro which computes the
// Blackman-Tukey periodogram
function [xm, fr]=bt(x)
  xsize = max(size(x))
  [xf,fr] = frmag(x,256)
  xm = xf.*conj(xf)/xsize
endfunction
[xm,fr] = bt(x);
scf();
subplot(3,1,1);
plot(x);
subplot(3,1,2);
plot(fr1,sm)
subplot(3,1,3);
plot(fr,xm)
| Report an issue | ||
| << czt | Estimation Spectrale | pspect >> |