Please note that the recommended version of Scilab is 2026.1.0. This page might be outdated.
See the recommended documentation of this function
xarrows
draw a set of arrows in 2D or in 3D.
Syntax
xarrows(nx, ny [,nz] [,arsize, color])
Arguments
- nx, ny, nz
real vectors or matrices of same size.
- arsize
a real scalar, size of the arrow head. The default value can be obtained by setting
arsizeto-1.- color
a matrix or scalar. If
coloris a positive scalar it gives the color to use for all arrows. If it is a negative scalar then the current color is used. If it is a vectorcolor(i)gives the color to use for arrowi.
Description
xarrows draws a set of arrows
given by nx, ny and nz.
If nz is not given, then the arrows are drawn in 2D.
If nx, ny and nz are vectors,
the i-th arrow is defined by
(nx(i),ny(i),nz(i))-->(nx(i+1),ny(i+1),nz(i+1)).
If nx, ny and nz are matrices:
nx=[xi_1 x1_2 ...; xf_1 xf_2 ...]
ny=[yi_1 y1_2 ...; yf_1 yf_2 ...]
nz=[zi_1 z1_2 ...; zf_1 zf_2 ...]
the k-th arrow is defined by (xi_k,yi_k,zi_k)-->(xf_k,yf_k,zf_k).
xarrows uses the current graphics
scale which can be set by calling a high level
drawing function such as plot2d.
Examples
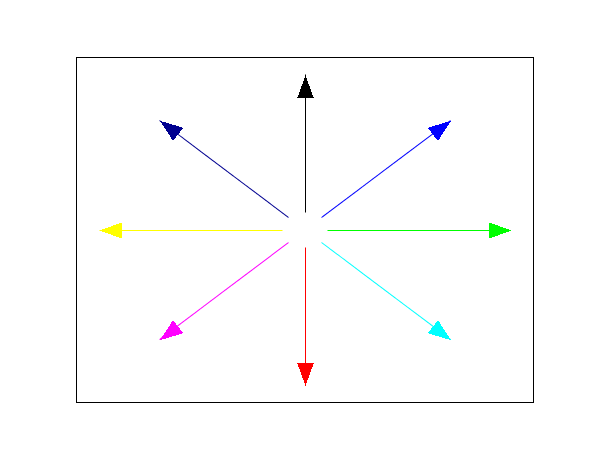
x = 2*%pi*(0:7)/8
x1 = [sin(x); 9*sin(x)];
y1 = [cos(x); 9*cos(x)];
plot2d([-10,10], [-10,10], [-1,-1], "022")
gca().clip_state = "clipgrf";
xarrows(x1, y1, -1, [1:7,9]) //8-th color is white
gca().clip_state = "off";
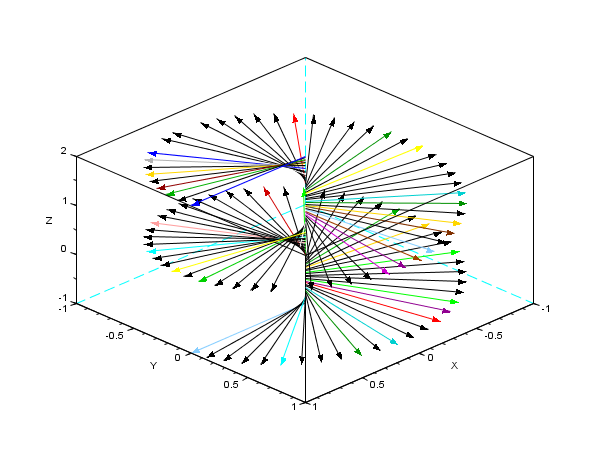
N = 100;
zi = linspace(-1,2,N);
zf = zi;
theta = (zi - min(zi))/(max(zi)-min(zi))*720;
xi = zeros(1,N);  xf = cosd(theta);
yi = zeros(1,N);  yf = sind(theta);
clf, plot3d([-1 1 1 1],[-1 -1 -1 1],[-1 -1 2 2])
xarrows([xi;xf],[yi;yf],[zi;zf],0.7, 32*rand(1,N))
History
| Version | Description |
| 5.5.0 | Arrows can be drawn in 3D. |
| Report an issue | ||
| << xarcs | geometric_shapes | xfarc >> |