- Scilab Help
- Graphics
- 2d_plot
- 3d_plot
- annotation
- axes_operations
- axis
- bar_histogram
- Color management
- Datatips
- figure_operations
- geometric_shapes
- handle
- interaction
- lighting
- load_save
- polygon
- property
- text
- transform
- GlobalProperty
- Graphics: Getting started
- Compound properties
- Graphics Entities
- object editor
- pie
- Segments properties
- xchange
- xget
- xgetech
- xgraduate
- xsegs
- xset
- xsetech
Please note that the recommended version of Scilab is 2026.0.1. This page might be outdated.
See the recommended documentation of this function
pie
draw a pie
Syntax
pie(x)
pie(x[,sp[,txt]])
Arguments
- x
a scalar or a vector of positive reals.
- sp
a real scalar or a vector of reals.
- txt
a cell or a vector of strings.
Description
pie(x): if size of x is N then pie function draws a pie
with N parts, the area of the ith part is equal to (x(i)/sum(x))*( surface
of the unit circle).
pie(x,sp):the sp vector allows to cut one or several
parts of the pie, (the size of sp must be equal to N). if the value of the
ith index of sp is different of zero then the ith part is separated from
the others by a space, else if it' s equal to zero then it is attached to
the others.
pie(x,txt): the txt vector allows to write a text for
each part of the pie, the ith component of txt corresponds to the ith part
(default : it's written the percentages which corresponds to the parts
surface). The size of txt must be equal to N.
Examples
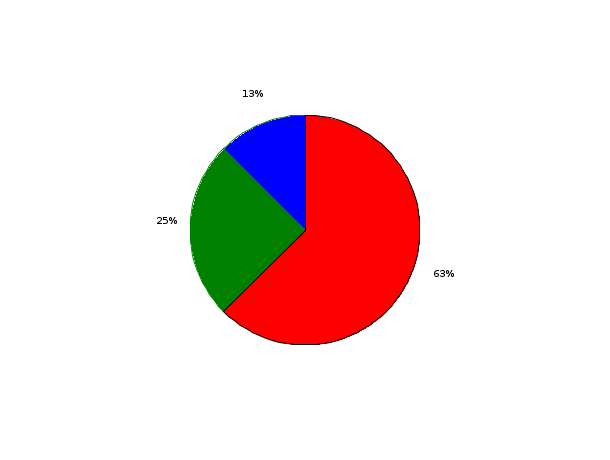
// First example : one input argument  x=[1 2 5]
scf(0);
pie([1 2 5]);

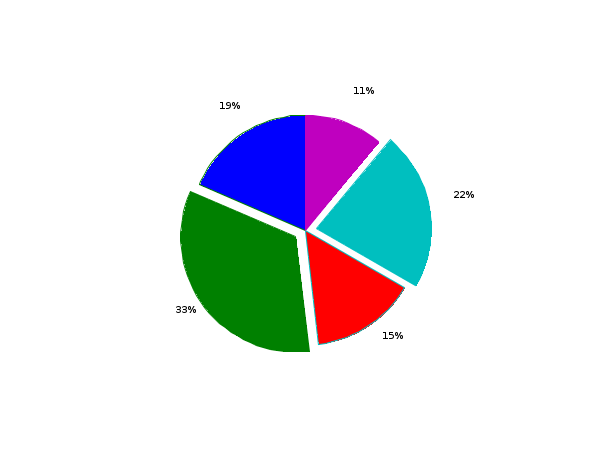
// Second example : two input arguments x=[5 9  4 6 3], sp=[0 1 0 1 0], the second and the fourth are separated of the others
scf(1);
pie([5 9 4 6 3],[0 1 0 1 0]);

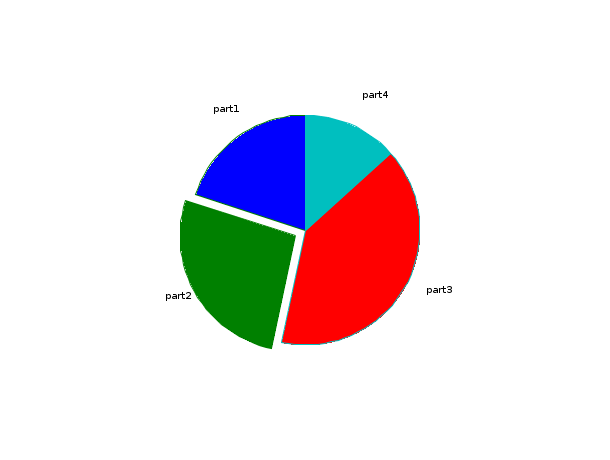
// Third example : three input arguments, x=[3 4 6 2], sp=[0 1 0 0], txt=["part1","part2","part3","part4"]
scf(2);
pie([3 4 6 2],[0 1 0 0],["part1","part2","part3","part4"]);

See also
- xfpolys — fill a set of polygons
| Report an issue | ||
| << object editor | Graphics | Segments properties >> |