Scilab Website | Contribute with GitLab | Mailing list archives | ATOMS toolboxes
Scilab Online Help
5.5.2 - English

Change language to:
Français - 日本語 - Português - Русский

Please note that the recommended version of Scilab is 2024.0.0. This page might be outdated.
See the recommended documentation of this function

Scilab Help >> Graphics > geometric_shapes > xrect

xrect

draw a rectangle

Calling Sequence

xrect(x,y,w,h)
xrect(rect) // with rect =[x,y,w,h]

Arguments

x,y,w,h

four real values defining the rectangle.

Description

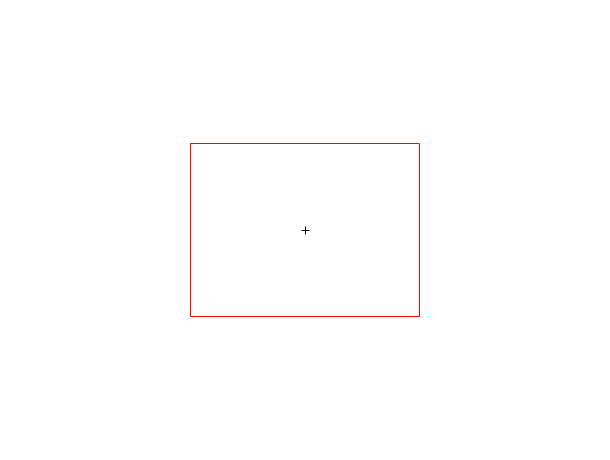
xrect draws a rectangle defined by [x,y,w,h] (upper-left point, width, height) in user coordinates.

Please note that height is positive downwards.
Created rectangle inherits the clip property from the current axes.

Examples

plot2d(0,0,-1,"010"," ",[-2,-2,2,2])
xset("color",5)
xrect(-1,1,2,2)

See Also

  • xfrect — fill a rectangle
  • xrects — draw or fill a set of rectangles
Report an issue
<< xfrect geometric_shapes xrects >>

Copyright (c) 2022-2023 (Dassault Systèmes)
Copyright (c) 2017-2022 (ESI Group)
Copyright (c) 2011-2017 (Scilab Enterprises)
Copyright (c) 1989-2012 (INRIA)
Copyright (c) 1989-2007 (ENPC)
with contributors
Last updated:
Wed Apr 01 10:13:57 CEST 2015