Scilab 5.5.2
- Scilab Help
- Graphics
- 2d_plot
- LineSpec
- Matplot
- Matplot1
- Matplot properties
- Sfgrayplot
- Sgrayplot
- champ
- champ1
- champ properties
- comet
- contour2d
- contour2di
- contour2dm
- contourf
- errbar
- fchamp
- fcontour2d
- fec
- fec properties
- fgrayplot
- fplot2d
- grayplot
- grayplot properties
- graypolarplot
- histplot
- paramfplot2d
- plot
- plot2d
- plot2d1
- plot2d2
- plot2d3
- plot2d4
- polarplot
Please note that the recommended version of Scilab is 2026.1.0. This page might be outdated.
See the recommended documentation of this function
plot2d4
2D plot (arrows style)
Calling Sequence
plot2d4([logflag,] x,y,[style,strf,leg,rect,nax])
plot2d4(y)
plot2d4(x,y <,opt_args>)
Arguments
- args
see
plot2dfor a description of parameters.
Description
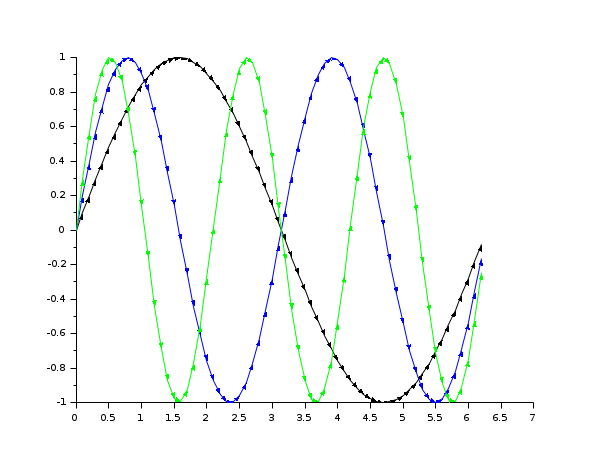
plot2d4 is the same as plot2d but curves are
plotted using arrows style. This can be useful when plotting solutions of
an ODE in a phase space.
By default, successive plots are superposed. To clear the previous
plot, use clf().
Enter the command plot2d4() to see a demo.
 | Note that all
the modes proposed by plot2dxx (xx = 1 to 4) can be enabled
using plot2d and setting the polyline_style
option to the corresponding number. |
Sample
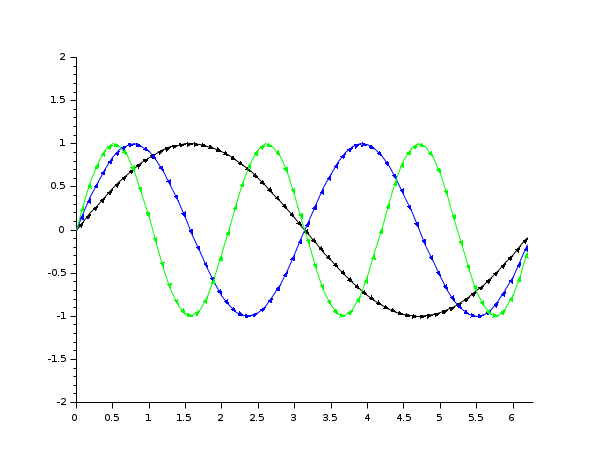
Examples
// compare the following with plot2d1
x=[0:0.1:2*%pi]';
plot2d4(x,[sin(x) sin(2*x) sin(3*x)])
clf()
plot2d(x,[sin(x) sin(2*x) sin(3*x)])
e=gce();
e.children(1).polyline_style=4;
e.children(2).polyline_style=4;
e.children(3).polyline_style=4;
See Also
- fchamp — direction field of a 2D first order ODE
- plot2d — 2D plot
- plot2d2 — 2D plot (step function)
- plot2d3 — 2D plot (vertical bars)
- subplot — divide a graphics window into a matrix of sub-windows
- clf — Clear or reset or reset a figure or a frame uicontrol.
- polyline_properties — description of the Polyline entity properties
| Report an issue | ||
| << plot2d3 | 2d_plot | polarplot >> |