Please note that the recommended version of Scilab is 2026.1.0. This page might be outdated.
See the recommended documentation of this function
legends
draw graph legend
Calling Sequence
legends(strings,style,<opt_args>)
Arguments
- strings
n vector of strings, strings(i) is the legend of the ith curve
Starting from Scilab 5.2, it is possible to write LaTeX or MathML expression.
- style
integer row vector of size n (the plot styles, third parameter of plot2d) or an integer 2 x n matrix, style(1,k) contains the plot style for the kth curve and style(2,k) contains the line style (if style(1,k)>0) or mark color (if style(1,k)<0).
- <opt_args>
This represents a sequence of statements
key1=value1,key2=value2,... wherekey1,key2,...can be one of the following:- opt
specify where to draw the legends; this parameter may be an integer flag (or equivalently a string flag) or a vector [x,y] which gives the coordinates of the upper left corner of the legend box. In the first case the possible values are:
- 1 or "ur"
the legends are drawn in the upper right-hand corner.
- 2 or "ul"
the legends are drawn in the upper left-hand corner.
- 3 or "ll"
the legends are drawn in the lower left-hand corner.
- 4 or "lr"
the legends are drawn in the lower right-hand corner.
- 5 or "?"
interactive placement with the mouse (default).
- 6 or "below"
the legends are drawn under the graph (which is resized accordingly).
- with_box
a boolean (default value %t) which sets ot not the drawing of the box.
- font_size
an integer (default value 1) which sets the size of the font used for the names in the legend.
Description
Puts a legend on the current plot using the specified strings as labels.
In the interactive placement (opt=5 or opt="?") move the legend box with the mouse and press the left button to release it.
This function allows more flexible placement of the legends than the leg plot2d argument.
Sample
Examples
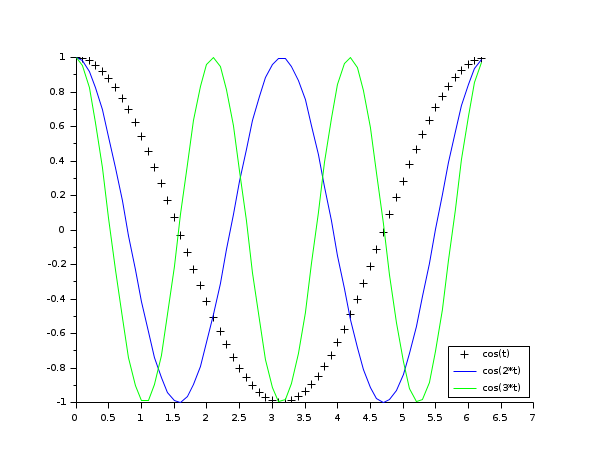
// Example 1
t=0:0.1:2*%pi;
plot2d(t,[cos(t'),cos(2*t'),cos(3*t')],[-1,2 3]);
legends(['cos(t)';'cos(2*t)';'cos(3*t)'],[-1,2 3],opt="lr")
t=0:0.1:2*%pi;
xset("line style",2);plot2d(t,cos(t),style=5);
xset("line style",4);plot2d(t,sin(t),style=3);
legends(["sin(t)";"cos(t)"],[[5;2],[3;4]], with_box=%f, opt="?")
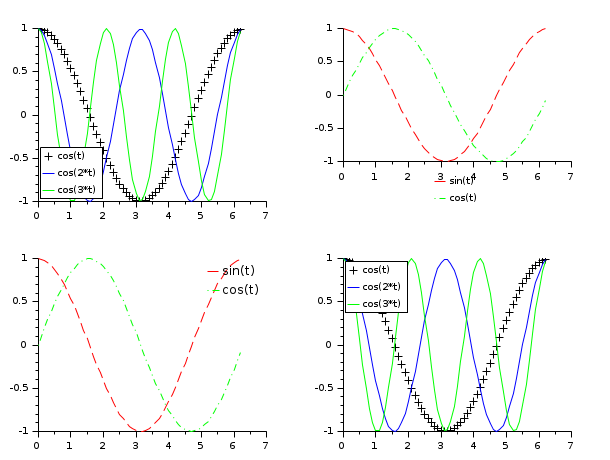
// Example 2
scf() ;
subplot(221)
t=0:0.1:2*%pi;
plot2d(t,[cos(t'),cos(2*t'),cos(3*t')],[-1,2 3]);
legends(['cos(t)';'cos(2*t)';'cos(3*t)'],[-1,2 3], opt=3 )

subplot(222)
xset("line style",2);plot2d(t,cos(t),style=5);
xset("line style",4);plot2d(t,sin(t),style=3);
legends(["sin(t)";"cos(t)"],[[5;2],[3;4]], with_box=%f, opt=6 )

subplot(223)
xset("line style",2);plot2d(t,cos(t),style=5);
xset("line style",4);plot2d(t,sin(t),style=3);
legends(["sin(t)";"cos(t)"],[[5;2],[3;4]], with_box=%f, opt=1, font_size=2 )

subplot(224)
t=0:0.1:2*%pi;
plot2d(t,[cos(t'),cos(2*t'),cos(3*t')],[-1,2 3]);
legends(['cos(t)';'cos(2*t)';'cos(3*t)'],[-1,2 3], opt=2, font_size=1 )
See Also
| Report an issue | ||
| << Legend entity properties | annotation | title >> |