PlotSparse
plot the pattern of non nul elements of a sparse matrix
Syntax
PlotSparse(A [,style])
Arguments
- A
a sparse matrix
- style
(optional) a string given the color and/or the marker type of the form "[color][mark]" where color may be a number referring the color you want to use (in the current colormap). If you use the std colormap then color may be one of the following letters :
k  for black       b  for blue
r  for red         g  for green
c  for cyan        m  for magenta
y  for yellow      t  for turquoise
G  a dark green
mark must be one of the following :
.  point           +  plus
x  cross           *  circled plus
D  filled diamond  d  diamond
^  upper triangle  v  down triangle
o  circle
by default you have "b." (in fact the 2d color) and this is also forced in case of error.
Description
plot the pattern of non nul elements of a sparse matrix : each non nul element is drawn with a marker. For "big" matrix use essentially the point . as marker
Examples
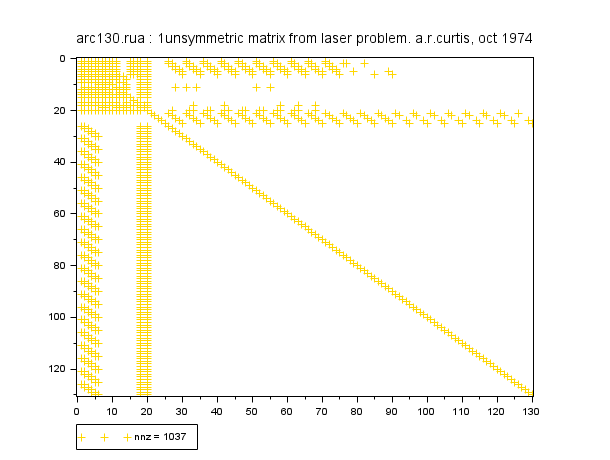
[A,description,ref,mtype] = ReadHBSparse(SCI+"/modules/umfpack/demos/arc130.rua");
PlotSparse(A,"y+")
xtitle(ref + "." + mtype + " : " + description)
See also
- ReadHBSparse — read a Harwell-Boeing sparse format file
| Report an issue | ||
| << UMFPACK Interface (sparse) | UMFPACK Interface (sparse) | ReadHBSparse >> |