subplot
устанавливает текущие оси в выбранную ячейку текущего показателя или рамки с привязкой к сетке
Синтаксис
subplot(m,n,p)
subplot(mnp)
Аргументы
- m, n, p
целые числа > 0. (m,n) = числа строк и столбцов виртуальной сетки. р = индекс целевой ячейки.
- mnp
целое число с десятичной нотацией
mnp
Описание
subplot(m,n,p) или
subplot(mnp) виртуально разделяет графическое
окно или uicontrol(frame) на матрицу подокон размером m-на-n, и выбирает
p-тое подокно для получения следующего графика.
В сетке, где ячейки индексированы вдоль каждого ряда, начиная с верхнего.
Следовательно, например, последняя ячейка первого ряда p будет
n-ной ячейкой. Ячейка в ряду №i и в столбце №j имеет индекс
p=(i-1)*n+j.
Когда выбранная зона точно соответствует существующим осям, то
subplot(…) просто устанавливает её в качестве текущих осей.
В противном случае subplot(…) создаёт пустые оси, по всей
выбранной зоне, готовые для получения следующего графического содержимого.
Примеры
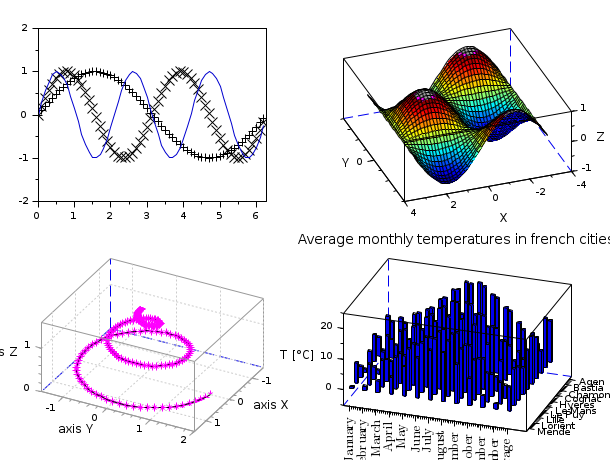
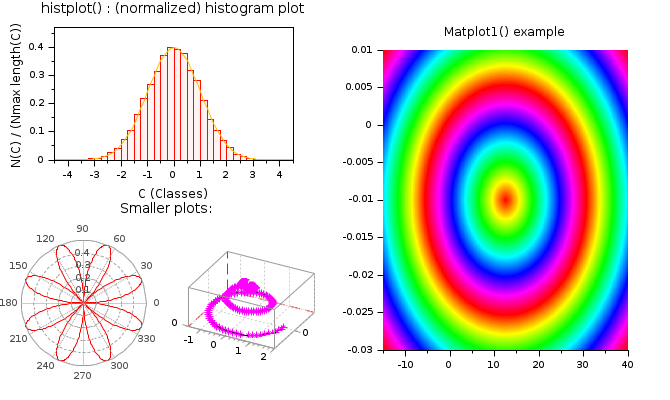
Более сложная компоновка, но по-прежнему разграфлённая:
clf
subplot(1,2,2)
Matplot1()
xtitle("Пример Matplot1()","","")

subplot(2,2,1)
histplot
delete(findobj("type","Legend"))

subplot(2,2,3)
title("Несколько меньшие графики:", "fontsize",3)

subplot(2,4,5)
polarplot()

subplot(2,4,6)
param3d()
xtitle("","","","")
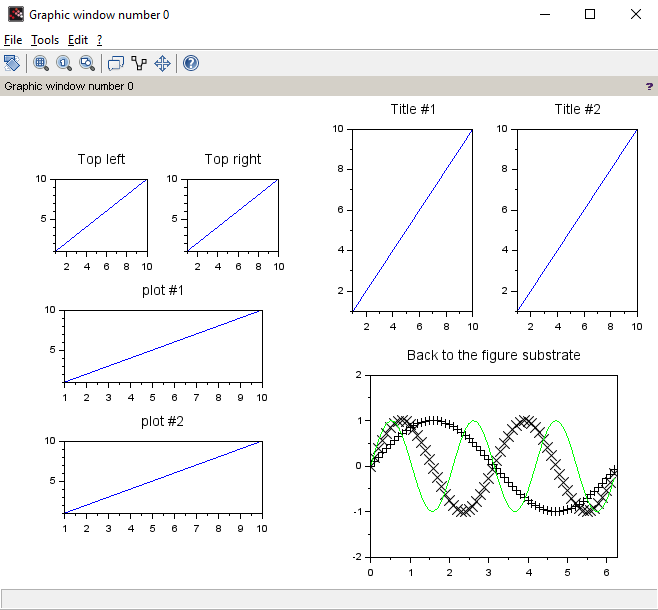
Usage on uicontrol frames :
f = figure("default_axes","off", "toolbar","none", "name","subplot in frames", ..
           "backgroundColor",[1 1 1]*0.97);
x = -4:0.05:4;

// Frame #1
b = createBorder("titled", "Frame #1");
uicontrol(f, "style", "frame", "units","normalized", "border", b, ..
                   "position", [0.03 0.83 0.94 0.15]);

// Frame #2
b(2) = "Frame #2";
fr2 = uicontrol(f, "style", "frame", "units","normalized", "border", b, ..
                   "position", [0.03 0.03 0.60 0.8]);
subplot(1,2,1)
plot(x, tanh(x)), title("tanh")

subplot(2,2,2)
plot(x, sinh(x)), title("sinh")

// Frame #3
b(2) = "Frame #3";
fr3 = uicontrol(f, "style", "frame", "units","normalized", "border", b, ..
                   "position", [0.65 0.03 0.32 0.8]);
set("current_entity", fr3);
subplot(2,1,1)
plot(2*x, sinc(2*x)), title("sinc")

subplot(2,1,2)
plot(2*x, sin(2*x)), title("sin")

// Back to Frame #2
set("current_entity", fr2);
subplot(2,2,4)
plot(x, cosh(x)), title("cosh")
--> gcf().children
 ans  =
3 by 1 matrix of handles:
=========================
uicontrol
uicontrol
uicontrol

--> gcf().children(1).children
 ans  =
2 by 1 matrix of handles:
=========================
Axes
Axes

--> gcf().children(2).children
 ans  =
3 by 1 matrix of handles:
=========================
Axes
Axes
Axes

--> gcf().children(3).children
 ans  =
    []
Смотрите также
- xsetech — set the sub-window of a graphics window for plotting
- newaxes — Creates a new Axes entity
- axes_properties — description of the axes entity properties
История
| Версия | Описание |
| 2024.0 | subplot(…) can be used on uicontrol frames. |
| Report an issue | ||
| << sda | axes_operations | unzoom >> |