Scilab 5.4.0
- Scilab help
- Graphics
- 2d_plot
- 3d_plot
- annotation
- axes_operations
- axis
- bar_histogram
- Color management
- Datatips
- figure_operations
- geometric_shapes
- handle
- interaction
- load_save
- pie
- polygon
- property
- style
- text
- transform
- window_control
- GlobalProperty
- Graphics: Getting started
- alufunctions
- clear_pixmap
- Compound_properties
- graphics_entities
- object_editor
- pixel_drawing_mode
- plzr
- rubberbox
- segs_properties
- show_pixmap
- square
- twinkle
- xbasr
- xchange
- xclear
- xdel
- xget
- xgetech
- xgraduate
- xgrid
- xname
- xnumb
- xpause
- xsegs
- xset
- xsetech
- xsetm
Please note that the recommended version of Scilab is 2025.1.0. This page might be outdated.
See the recommended documentation of this function
xgrid
2次元プロットにグリッドを追加
呼び出し手順
xgrid([style])
引数
- style
整数
説明
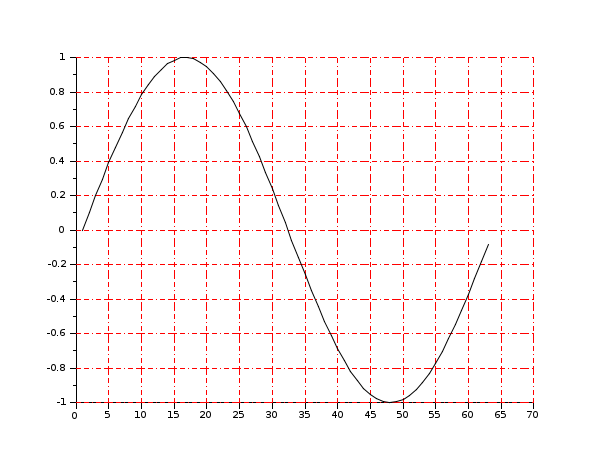
xgrid は2次元プロットにグリッドを追加します.
グリッド表示を行う場合,
style はダッシュIDまたはカラーIDとします.
IDの意味を知るにはxset()を使用してください.
例
| Report an issue | ||
| << xgraduate | Graphics | xname >> |