Scilab 5.5.2
- Scilabヘルプ
- Graphics
- Color management
- addcolor
- autumncolormap
- bonecolormap
- color
- color_list
- colorbar
- colordef
- colormap
- coolcolormap
- coppercolormap
- getcolor
- graycolormap
- hotcolormap
- hsv2rgb
- hsvcolormap
- jetcolormap
- name2rgb
- oceancolormap
- pinkcolormap
- rainbowcolormap
- rgb2name
- springcolormap
- summercolormap
- whitecolormap
- wintercolormap
Please note that the recommended version of Scilab is 2026.0.1. This page might be outdated.
However, this page did not exist in the previous stable version.
hsvcolormap
Hue-saturation-value カラーマップ
呼び出し手順
cmap = hsvcolormap(n)
引数
- n
整数 >= 1,カラーマップの大きさ.
- cmap
3つの列
[R,G,B]を有する行列.
説明
hsvcolormap はn色を有するカラーマップを
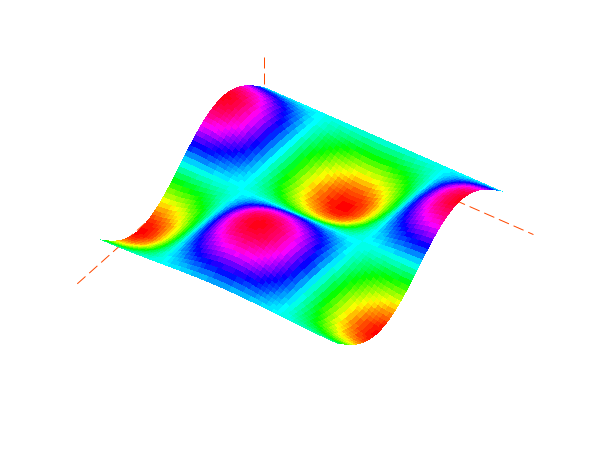
計算します.このカラーマップは hsv カラーモデルの hue 要素を変化させます.
色は, 赤から始まり,黄色, 緑, シアン, 青, マゼンタを通り, 赤に戻ります.
このマップは特に周期関数を表示する際に有用です.
例
t=[0:0.1:2*%pi]'; z=sin(t)*cos(t');

f=gcf();f.color_map=hsvcolormap(64);

plot3d1(t,t,z,35,45,"X@Y@Z",[-2,2,2])

参照
- colormap — カラーマップを定義
- autumncolormap — 赤からオレンジを経由して黄までのカラーマップ
- bonecolormap — ライトブルー色調のグレーカラーマップ
- coolcolormap — シアンからマゼンタに至るカラーマップ
- coppercolormap — 黒から明るい銅色へのカラーマップ
- graycolormap — 線形グレイカラーマップ
- hotcolormap — 赤から黄色までのカラーマップ
- hsvcolormap — Hue-saturation-value カラーマップ
- jetcolormap — 青から赤へのカラーマップ
- oceancolormap — 線形青カラーマップ
- pinkcolormap — 白黒画像のセピア調カラー化
- rainbowcolormap — 赤からオレンジ,黄色,緑,青を経て紫に至るカラーマップ
- springcolormap — マゼンタから黄色へのカラーマップ
- summercolormap — 緑から黄色へのカラーマップ
- whitecolormap — 完全に白のカラーマップ
- wintercolormap — 青から緑へのカラーマップ
| Report an issue | ||
| << hsv2rgb | Color management | jetcolormap >> |